
Know what happened, and what it cost
Each morning Home tells you what got done yesterday and what is waiting on you. Tap Cost to see exactly what your AI spent today, this week and all time, by project and by model.
- Where
- Home
- You'll need
- A connected AI provider for the written brief. The numbers work without it
- Works on
- Web, Mac, Windows, iPhone, Android
What you’ll see
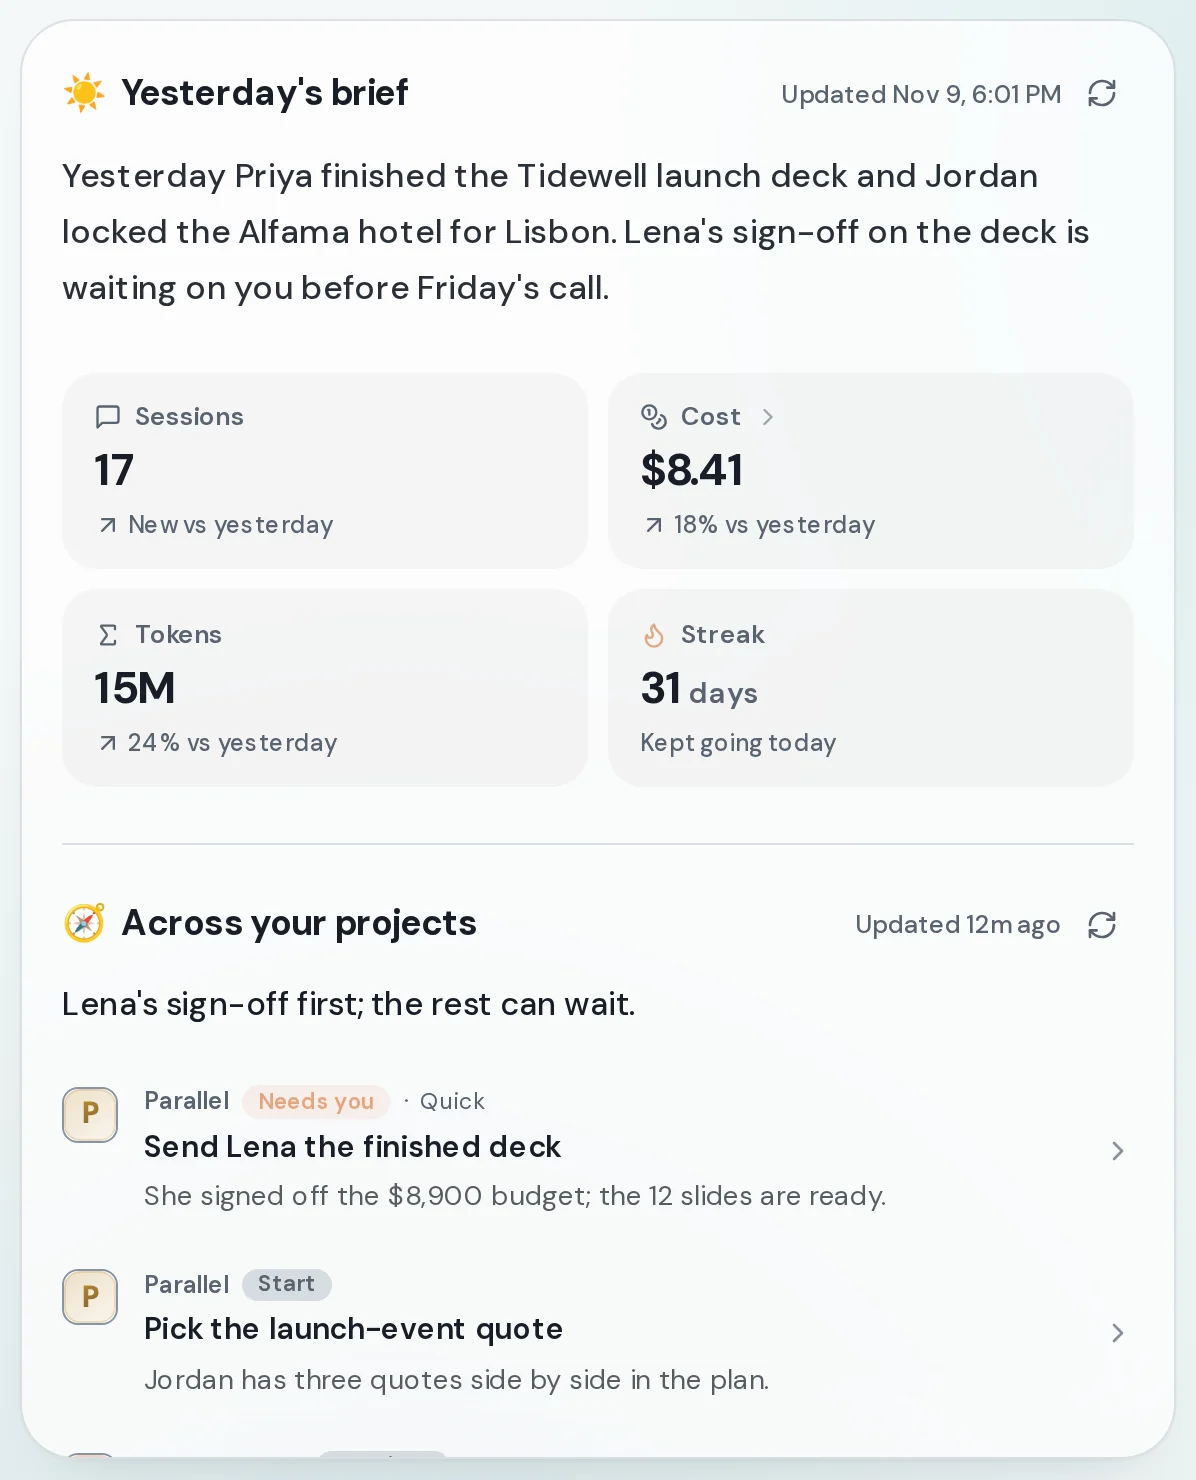
Section titled “What you’ll see”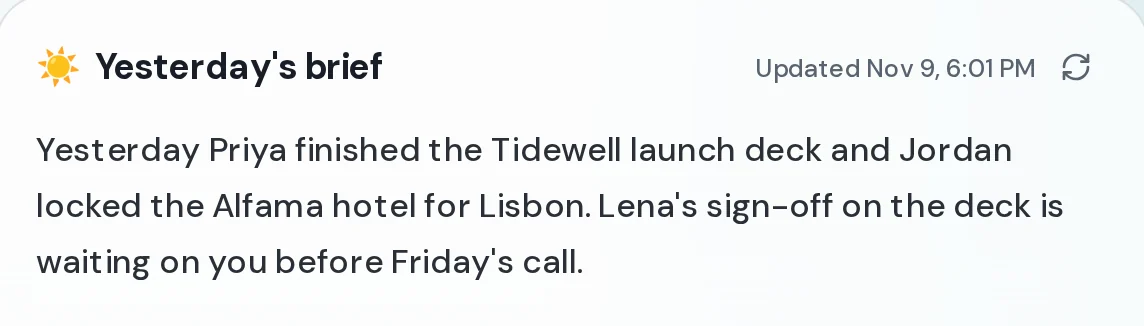 Daily briefOne short paragraph on what got done and what is waiting on you. The title reads "Yesterday's brief" or "Today so far", with the time it was written. The round arrow rewrites it.Top of Home
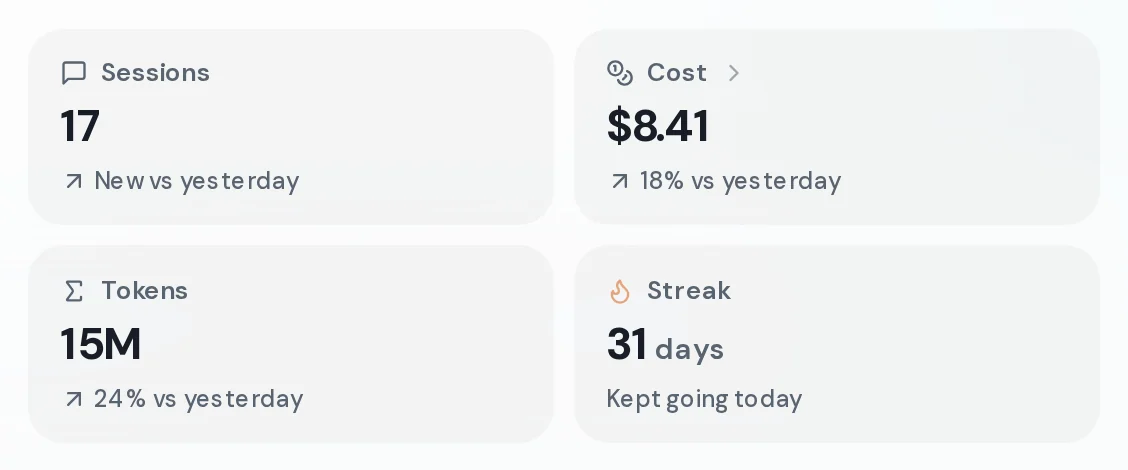 Today's numbersSessions, Cost, Tokens and Streak for today. The small line under each compares it with yesterday at the same time of day.Under the brief
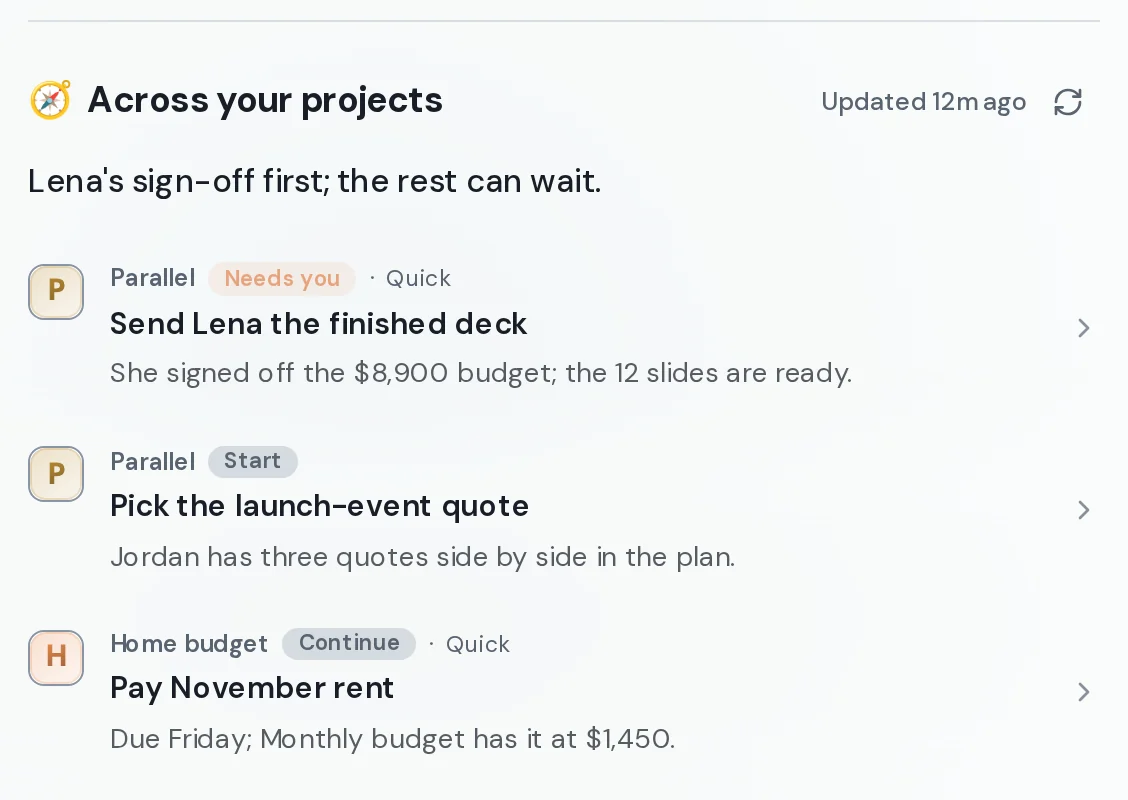 Across your projectsThe few things worth doing next, across all your projects. Each has a label such as Needs you, Continue or Start. Click one to open its chat.Under the numbers
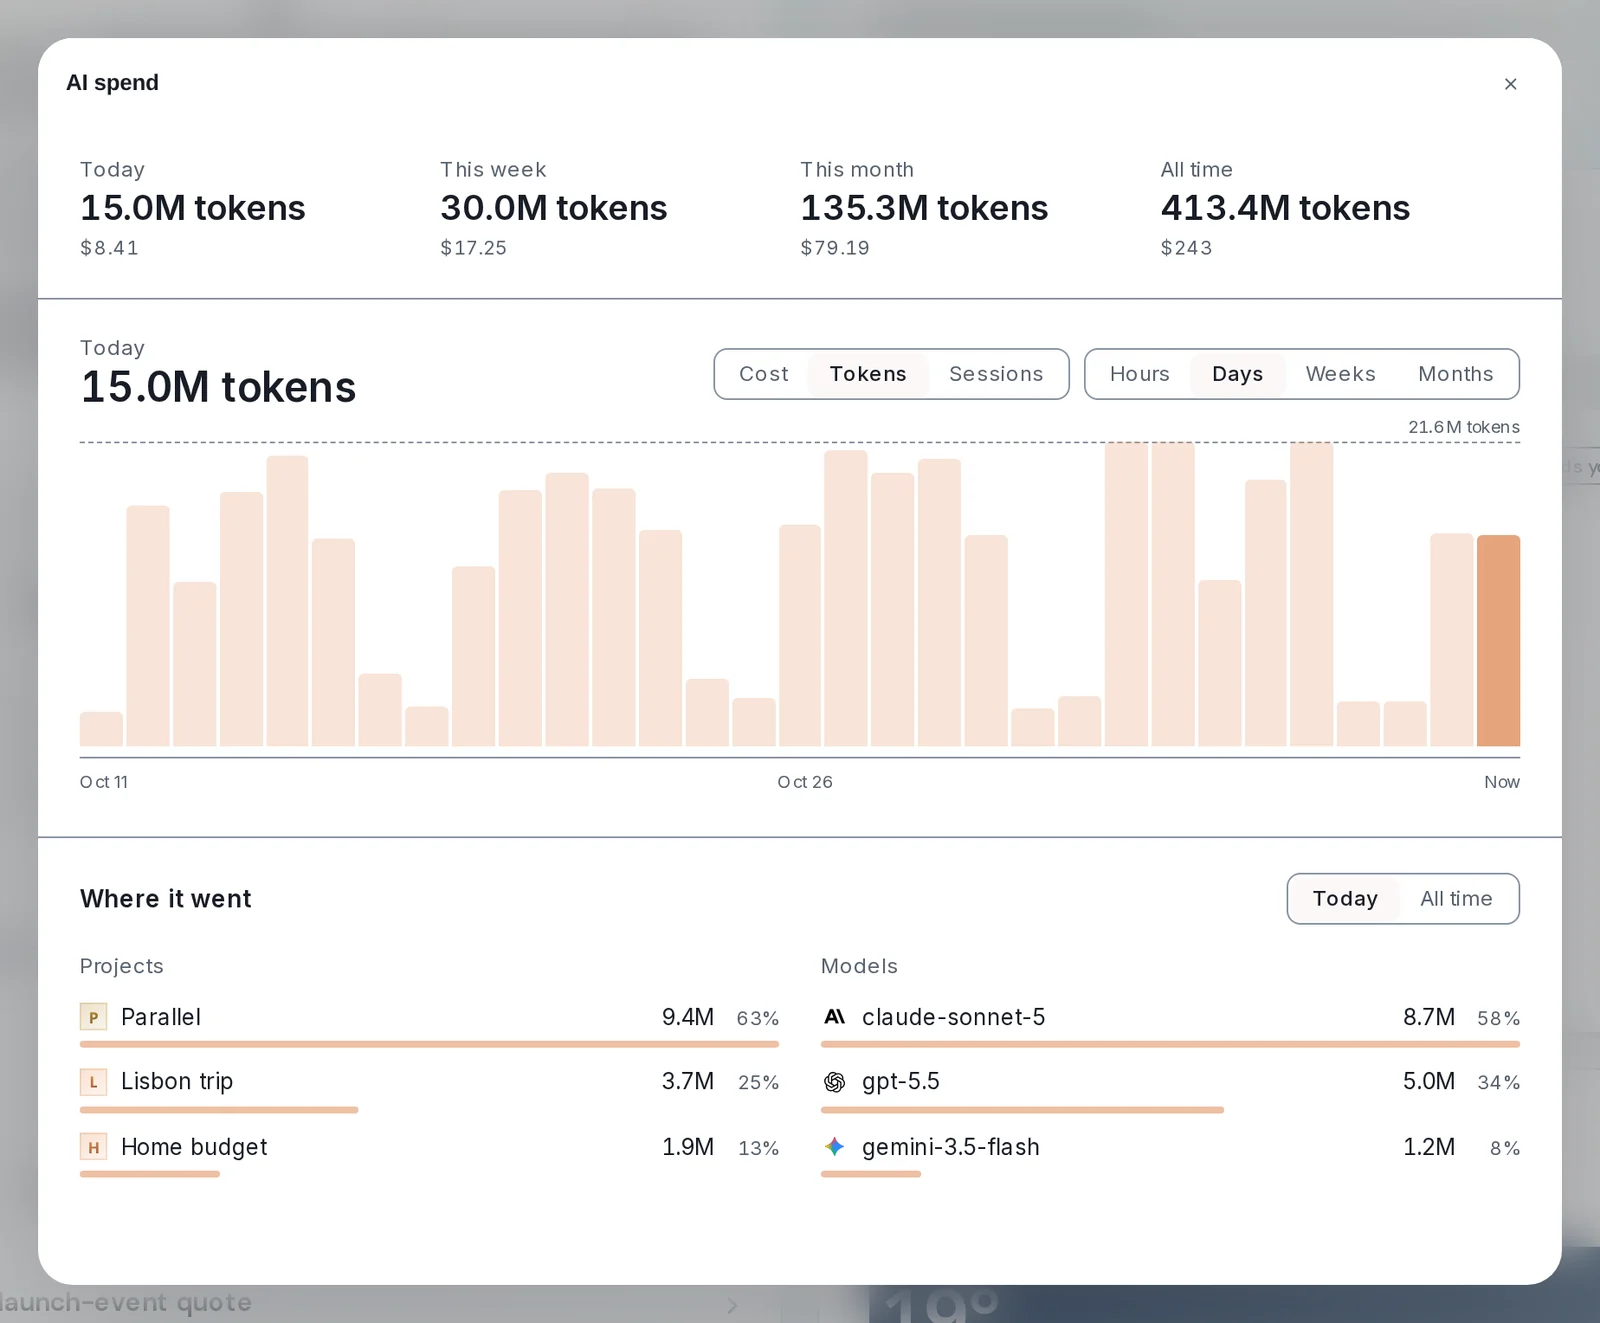
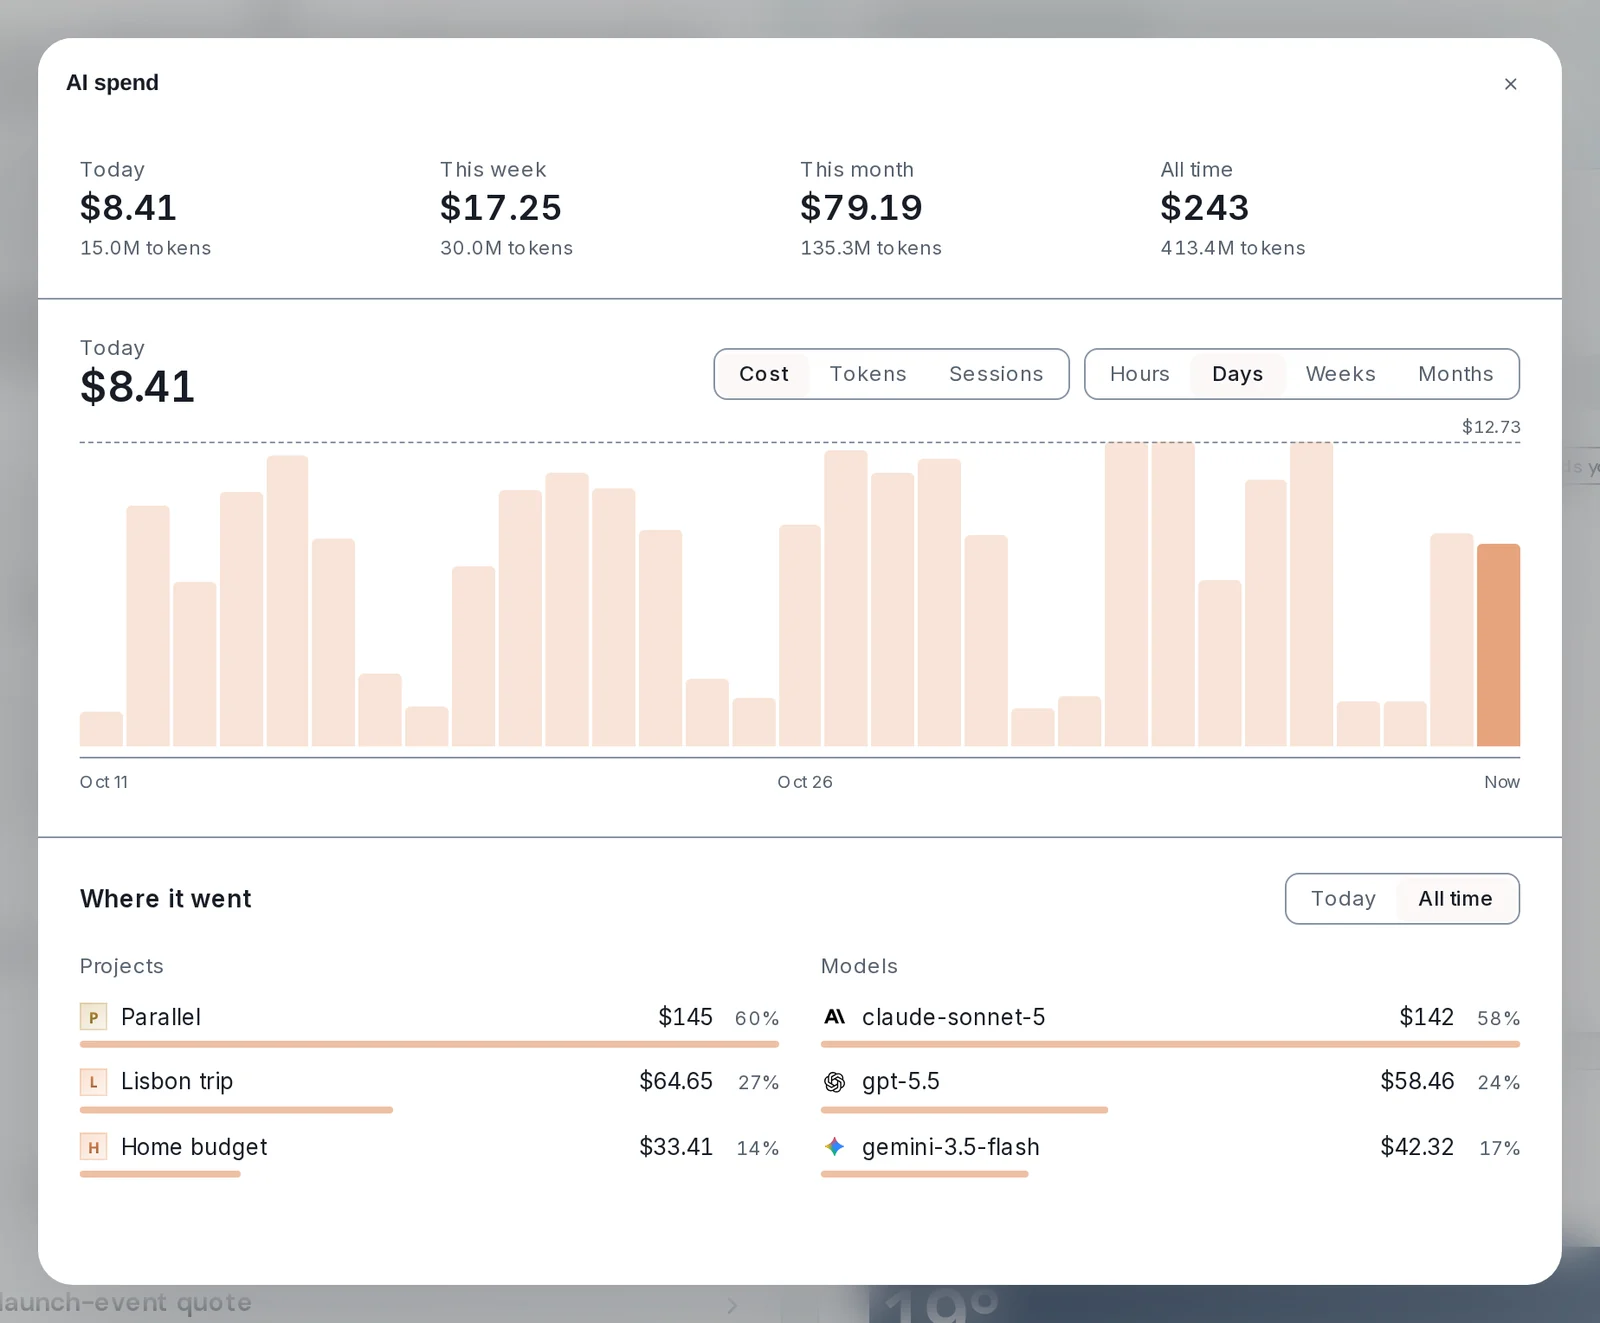 AI spendEverything your AI has cost, in one window: totals at the top, a chart in the middle, and where the money went at the bottom.Opens when you click Cost
 TotalsSpend for Today, This week, This month and All time, with the tokens used.Top of the AI spend window
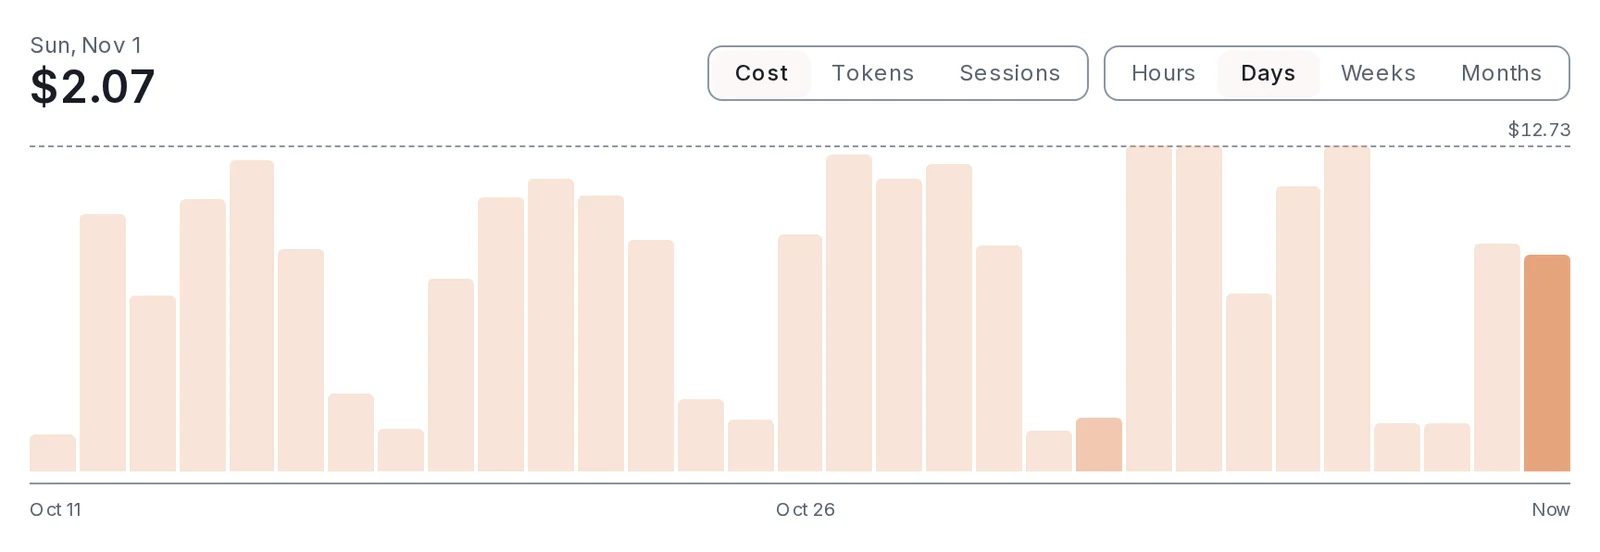
 Chart switchesThe first switch changes what the chart counts: Cost, Tokens or Sessions. The second changes the time step: Hours, Days, Weeks or Months.Above the chart
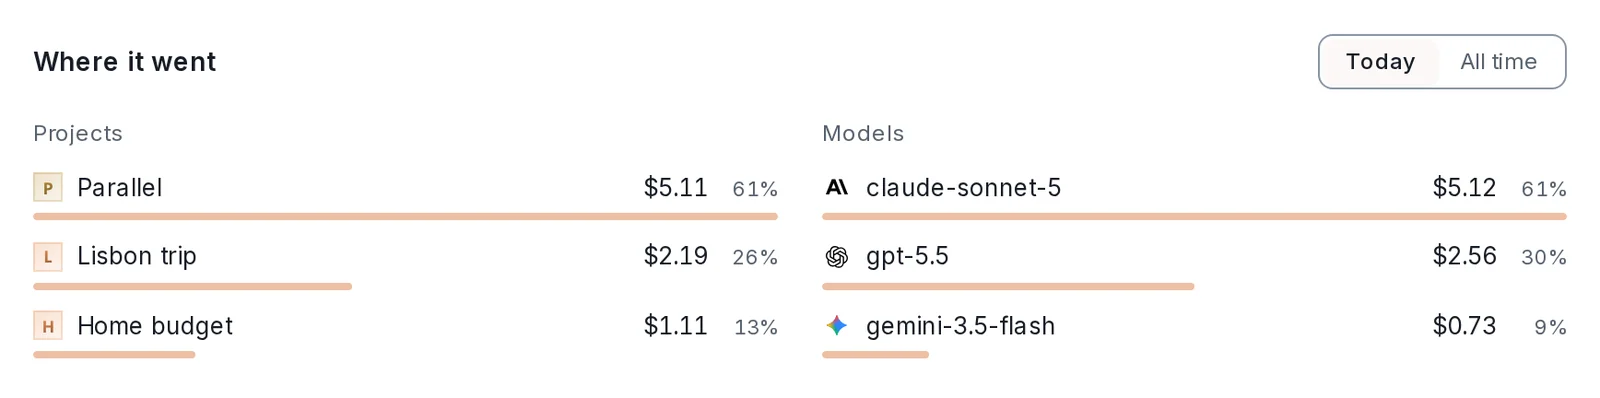
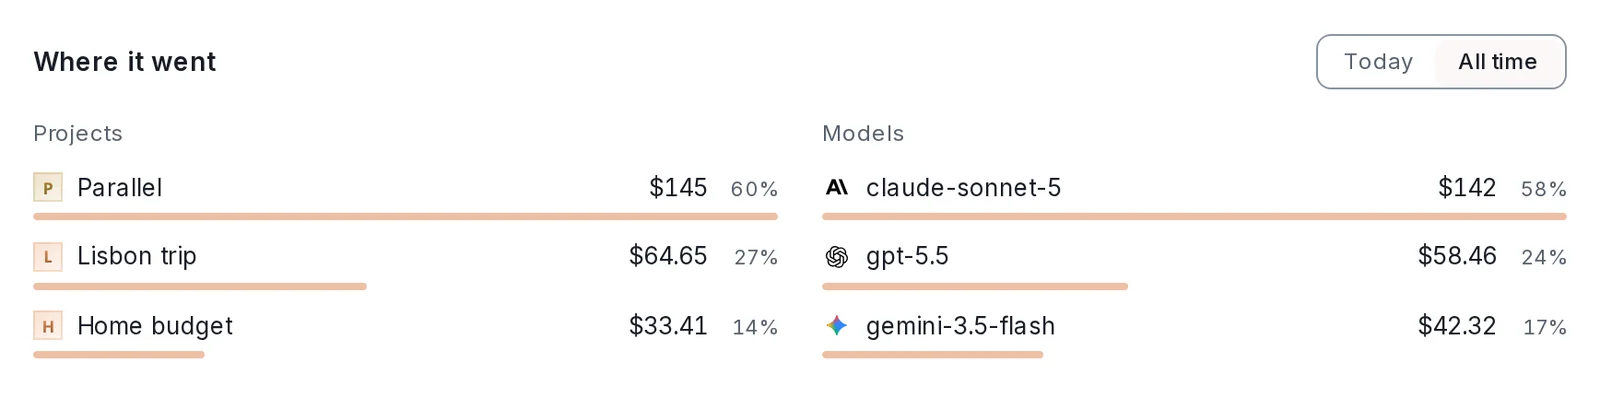 Where it wentThe same spend split two ways: by Projects and by Models. Switch between Today and All time.Bottom of the AI spend window
How to do it
Section titled “How to do it”Step 1: Open Home
Home is the first page of Axis. At the top is the brief: what got done and what is waiting on you.
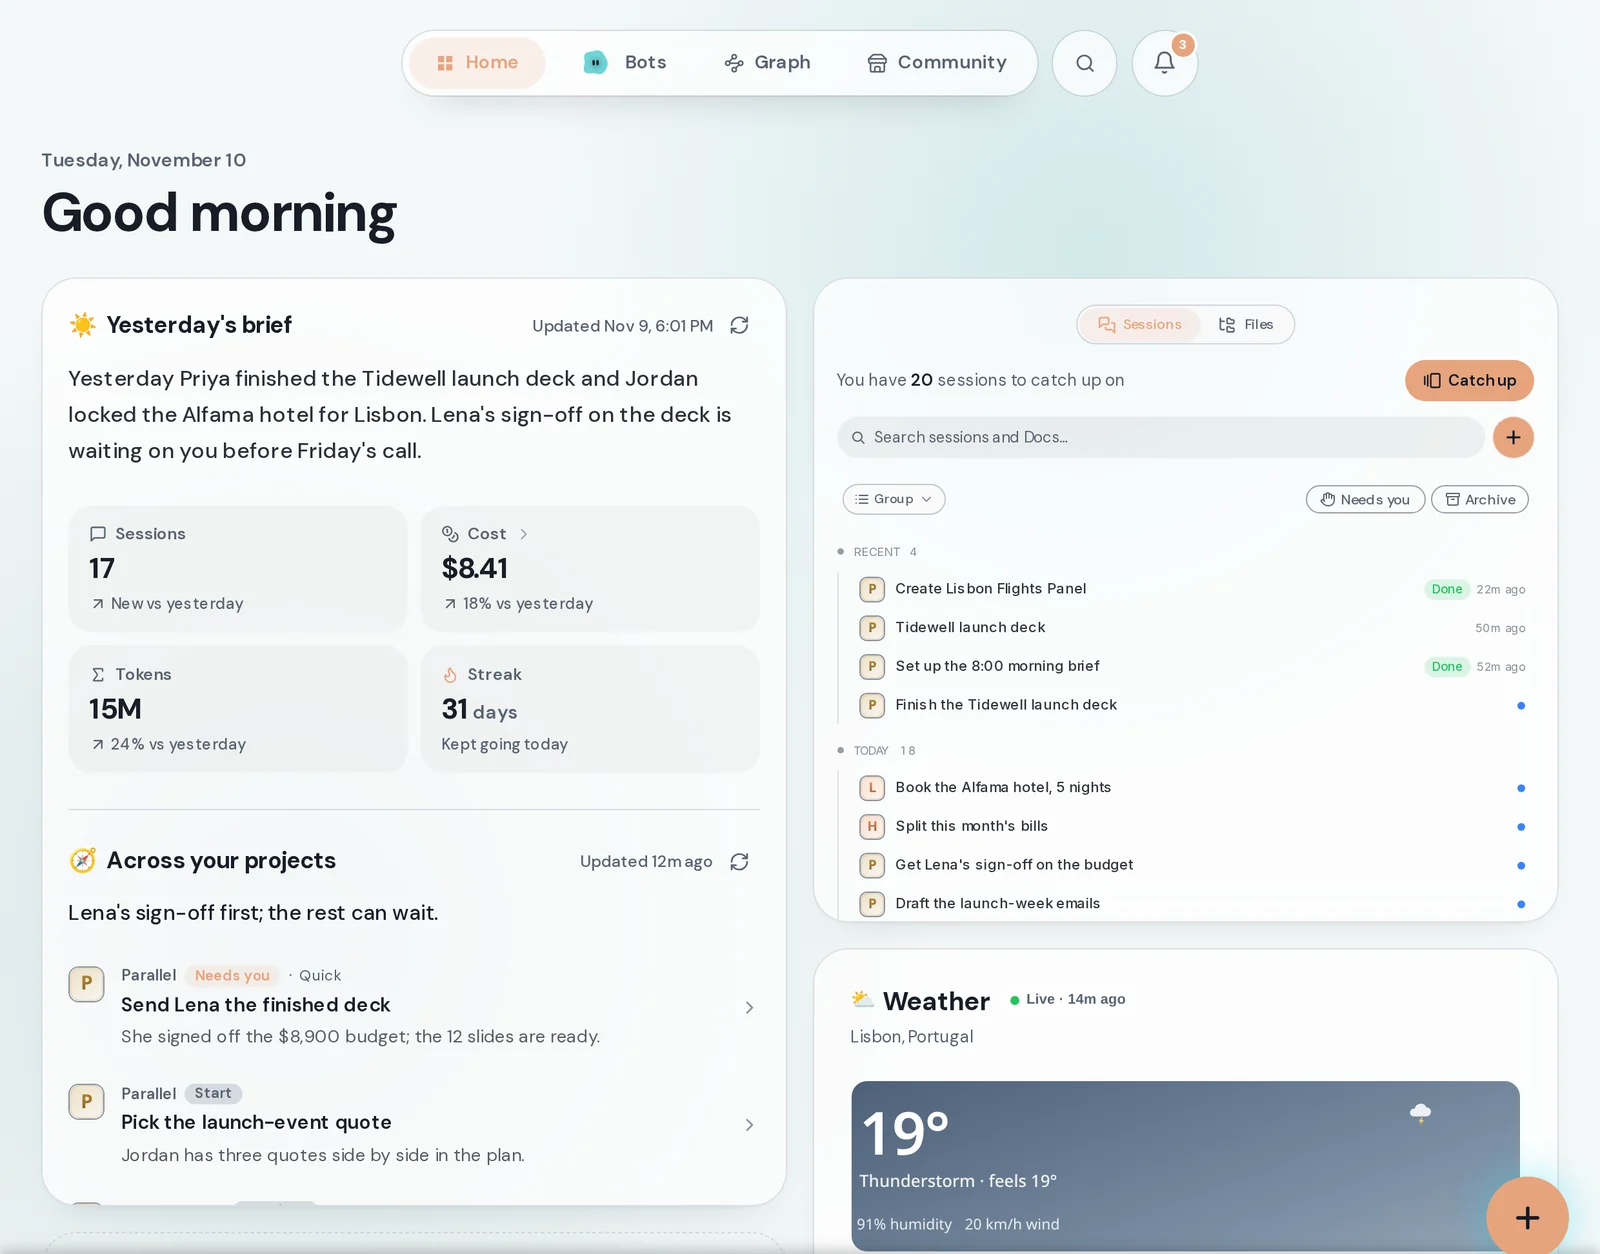
Press the round arrow beside the time to rewrite the brief with the latest.
Step 2: Check today's numbers
Under the brief, four tiles show today's Sessions, Cost, Tokens and Streak. Below them, Across your projects lists what to do next.
Step 3: Click Cost
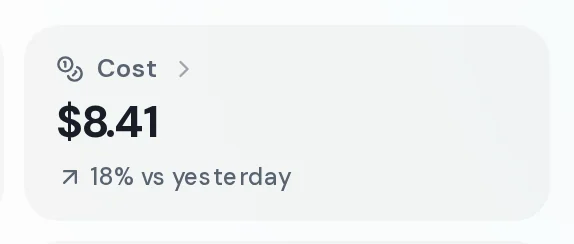
The Cost tile is a button. Click it and the AI spend window opens.
Step 4: Look at one day
The chart shows one bar per day. Point at a bar to read that day's spend above the chart. Switch to Weeks or Months for the longer view.
Step 5: See where it went
Under the chart, Where it went splits the spend by project and by model. Press Today to see only today.
Step 6: Switch to tokens
Press Tokens and the whole window reads in tokens instead of dollars. Press Cost to switch back.
- If the brief only shows a count of sessions, no AI provider is connected for writing it yet. Connect one and the written brief appears.
- Streak counts the days in a row you have used Axis.
- AI spend opens on all-time totals. Use Today when you want to know about this morning only.